
Updating the PBIReport.JSON file with the Power BI Performance load testing Values
In the 3rd part of my blog series on Power BI Performance testing, we are now going to take all the values we complete in the previous blog post and update the PBIReport.JSON file.
The reason I did this in a separate blog post is because working with JSON files can be tricky and adding to that putting in GUIDS can make it even more difficult.
Previous Blog posts:
- Why should I complete Power BI Performance Load Testing & initial setup – FourMoo | Microsoft Fabric | Power BI
- How to get the details for Power BI Performance load testing – FourMoo | Microsoft Fabric | Power BI
In future blog posts I will complete the following:
- Running a Power BI Performance load test using Visual Studio Code
- Run the load test simulating users,
- Give an example of what it looks like while it is running.
- View the Capacity Units from the Metrics App to understand how much Capacity the report consumed.
Example
I am going to be using Visual Studio Code to edit the PBIReport.JSON.
It is free to download and use, it works on any device.
And most importantly it will also show you errors in the JSON file. This can help when there are potential issues.
For the test I will be putting in the following details below into the PBIReport.JSON
Running the set-up script
The final step in this blog post is to run the setup script so that you are at the point where everything that you have installed and configured is working as expected.
In the future blog posts is where I will explain in more detail how to use the setup script.
- I opened Visual Studio code.
- I then navigated to my folder where I had extracted the Zip file, went into the folder called “RealisticLoadTestTool”
- I opened the file called “Setup_Load_Test.ps1”
- This is what it looked like when I opened the file

- In the side bar I clicked on “Run and Debug”
- I then again clicked on the blue button ”Run and Debug”, which will now run the PowerShell script.
- I am then prompted to enter the folder location of the master files. As shown below, because I am not in the right folder, it is prompting me where the files are.

- I put in the entire folder path as with my working example below.

C:\Users\gq\Downloads\PowerBI-Tools-For-Capacities-master\PowerBI-Tools-For-Capacities-master\RealisticLoadTestTool
- Next it will ask how many reports do I want to configure. I put in 1

- The next sequence is where it will now authenticate using my credentials I use to log into Power BI.
- NOTE: The reason for this is because it needs to create an authentication token which can be used to run the reports.

- I select my Microsoft Account and authenticate.

- Once I have signed in I will get a notification that it has completed. I can then close the browser window.

- It wil then list all the workspaces I have got access to.
- As with my example I look for the Workspace called “PPU Space Testing”

- I put in 13 and press Enter

- Next, it asks me which report do I want to test.
- From the list I select 23 and press Enter.

- The code will then create the required files and give you the configuration path where the files have been created.
- As in the example below I can find the files in a folder called “07-17-25_05_41_08”

- I then go to this folder where I can see the following files.

Editing the PBIReport.JSON
The steps below is where I will show you how to take the values, we saved in the previous blog post and put them into JSON file.
Having previously captured the values makes editing the JSON file quick and easy.
I open the PBIReport.JSON in Visual Studio Code.
The new file will look like the following below.

Adding in the Page Name
First, we will be adding in the page name.
The page name I wanted to test was called “ReportSection”
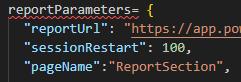
"pageName":"ReportSection",
Adding in the Bookmarks
Next, I added in the bookmarks.
In my working example the bookmarks GUIDS were “bookmarkGuid=72c9854a720a0d4652e8, bookmarkGuid=80b2a69dce76840e9809”
NOTE: Only use the GUID section, so everything after “bookmarkGuid=”

“bookmarkList”: [“72c9854a720a0d4652e8, 80b2a69dce76840e9809”],
Adding the Slicer Values’
NOTE: When adding in any of the values it is case sensitive so make sure that the data matches exactly!
I go back to my Excel file and open it to get the slicer values.
This is where it can get a little tricky, due to having to put the Customer Values into the JSON array.
In line 8, I put in my table name “Customers”
In line 9, I put in my column name “Customers”
In line 10, this is where I set the isSlicer to “true” which says that use the slicer on the page when completing the performance testing.
Lines 11-16 is where I put in my values. Please NOTE that the last value does not have a comma at the end in line 16.
Line 18 and 19 I am closing off my first filter section.

  "filters": [
    {
      "filterTable":"Customer",
      "filterColumn":"Customer",
      "isSlicer":true,
        "filtersList":["Tailspin Toys (Absecon, NJ)",
        "Tailspin Toys (Aceitunas, PR)",
        "Tailspin Toys (Airport Drive, MO)",
        "Tailspin Toys (Alstead, NH)",
        "Tailspin Toys (Amanda Park, WA)",
        "Tailspin Toys (Andrix, CO)"

      ]
    },
Adding in the Filter Values
I go back to my Excel file and open it to get the Color filter values.
This is where it can get a little tricky, due to having to put the Color Values into the JSON array.
In line 21, I put in my table name “Stock Item”
In line 9, I put in my column name “Color”
In line 10, this is where I set the isSlicer to “false” which says that use the filter pane when completing the performance testing.
Lines 24-31 is where I put in my values. Please NOTE that the last value does not have a comma at the end in line 31.
Line 32 and 33 I am closing off my first filter section.

{
      "filterTable":"Stock Item",
      "filterColumn":"Color",
      "isSlicer":false,
        "filtersList":["Black",
        "Blue",
        "Gray",
        "Light Brown",
        "N/A",
        "Red",
        "White",
        "Yellow"
      ]
    },
I then add in an additional Filter for my Package filter values.
This is where it can get a little tricky, due to having to put the Package Values into the JSON array.
In line 35, I put in my table name “Order”
In line 36, I put in my column name “Package”
In line 38, this is where I set the isSlicer to “false” which says that use the filter pane when completing the performance testing.
Lines 38-41 is where I put in my values. Please NOTE that the last value does not have a comma at the end in line 41.
Line 42 and 43 I am closing off my first filter section.
NOTE: Because this is the end of my filters section there is no comma on line 43

{
      "filterTable":"Order",
      "filterColumn":"Package",
      "isSlicer":false,
        "filtersList":["Bag",
        "Each",
        "Packet",
        "Pair"
      ]
    }
How to configure for Field Parameters
Field Parameters is a newer feature, and the good news is that this too can be done in an automated way for the performance testing.
To test this that I would do is to get all the values for my field parameters table and create it as another “Filter Values” section in my JSON file.
In my next blog post where I actually run the load test, I will show you what changes you need to make to your report for the field parameters to be load tested successfully.
Configuring the ThinkTimeSeconds
Next is set the time for the ThinkTimeSeconds, this is how long will the page wait once all the visuals have fully loaded.
I like to think of this being a user who has interacted with report and is now looking at the changes.
I typically configure this to 25 seconds.
![]()
"thinkTimeSeconds":25
Initial Test
What you can now do to make sure that it works is to do an initial test.
This is going into the folder where you have been editing the PBIReport.JSON and double click the file “RealisticLoadTest.html”
This should load in your browser successfully as shown below.

Summary
In this blog post I have shown you how to update the PBIReport.JSON file with the required information for the performance load testing.
I also did a quick test to make sure it is working as expected.
In the final blog post on this series, I will show you how to run this for multiple users and how to view the Capacity Metrics App to see how the performance testing performed.
Thanks for reading and any comments or suggestions are always welcome!
[…] Gilbert Quevauvilliers continues a series on Power BI performance load testing: […]
Loving this series so far. You write some of the best stuff out there.
Thank you.