
BI-RoundUp – Power BI (February Update, Data.World Connector)
There has not been a lot happening in the past few weeks, but I am delighted to have another blog post with the latest Power BI updates.
Power BI – February Update

As I do every month I will go through in fairly light detail the new features in Power BI. And there are some fantastic new features.
Reporting
The first is now the capability to multi-select items across multiple charts.
This is great because people can gain more insights because it will cross filter between what you have selected.
As well as if you are bookmarking any of your multi-select they will too be remembered as part of the bookmark.

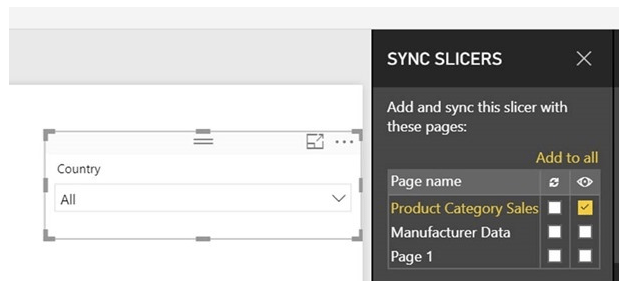
The next update is another big one, which people have been asking for some time, is the ability to Sync slicers across different report pages.
It is very easy to set up and integrate into your reporting.
As Amanda mentioned in her video, you now could have a starting page, where you define all your slicers, which will then affect all the other reporting pages.
There has been an update to the Numeric Slicer, where now if it is a whole number data type for the column, it will only show the whole number.
Previously if it was a Whole Number data type for the Numeric slicer it would show it with the decimal points.

There is now also an improvement with the Bing Geocoding currently in the Power BI Service, which should render the points on the map quicker. It will come to the Power BI Desktop at a later time.
You can now also configure the overflow of data labels on bar and column charts.
This is great for when you want to show the entire number. It will still only display it when there is the required space to do so for larger items, smaller items as currently done will not be displayed.

When formatting or using the Analytics Pane, there now is an option to search for settings. This is great because the Formatting pane is getting more and more options, so this will make it easier to find what you are looking for.

You can now specify your own custom date table. This is great because it will work with all the existing Time Intelligence features, as well as the quick measures.
You will just have to ensure that it meets the Date table criteria.


The Quick measures is now generally available and no longer needs to be enabled as a preview feature.
Custom Visuals
There now is the capability for your organization to be able to define which Custom Visuals can be used by the Organization. This is great in terms of governance and compliance so that the report developers know that the Custom Visuals signed off by the Organization can be used.

There are a whole host of new custom visuals as shown below.
Network Visualization and Filter

Slope Chart by MAQ Software

Filter by List

as Timeline

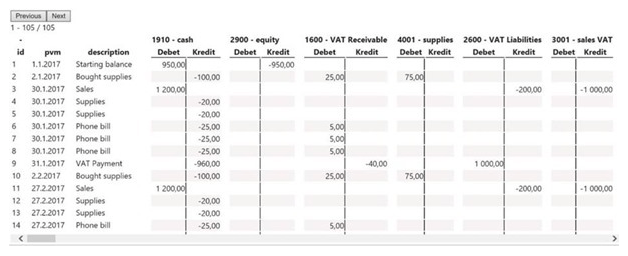
as T-Accounts
Performance Improvements
There is a whole host of performance improvements, mostly aimed at DirectQuery for SQL Server.
- DirectQuery performance improvements
- Open and save performance improvements
- “Show items with no data” improvements
Upcoming – Persistent Filters in Power BI Service
This is yet another feature that a lot of users have been asking for.
This will allow the report developer to define when a user comes back to an existing report if the filters that were set the last time the user was using the report will persist.
This is once again a great upcoming feature, which will make it a lot quicker and easier to view reports on a daily basis.
And finally, there is now an option to find Power BI Consulting services from Microsoft partners.
If you want more details, you can find the entire blog post here: Power BI Desktop February Feature Summary
Power BI – Data.World Connector
If you did not know there is a Data.World connector which hosts a whole host of publicly shared data.
The blog post from the Power BI team goes through and explains how you can easily leverage this data in Power BI.
As well as there being a Webinar on how to use the Data.World connector
Great