SSAS – KPI’s – Example of creating a KPI
Based on the previous BLOG post <font color="#ff000, we are going to explain how to create a KPI
Example
· Using our Internet Sales cube, we want to create a KPI in order to see if the guys are meeting their new target which is a 10% increase from their current sales.
· So we will create a new KPI with the following:
o The KPI Goal will be 10% greater than the current sales
o The KPI Status will be if the KPI value is 100% greater than the KPI Value.
o The KPI Trend will be based on the Previous Value selected from your Date Dimension using the Calendar Hierarchy
You can get a copy of this here: http://msftdbprodsamples.codeplex.com/releases/view/55330
· I used the AdventureWorksDW2012 Data File and AdventureWorks Multidimensional Models SQL Server 2012
NOTE: We are using SQL Server 2014, and SSDT for Visual Studio 2013
1. Go into the Adventure Works cube.
2. Click on the KPIs and then select New KPI
3. Next we will give the KPI the following name and associate it to our Internet Sales Measure group
4. Now we will configure our Value Expression, which as per our example will be the Internet Sales amount
5. Next we will configure our Goal Expression which will be 10% greater than our Value Expression
b. NOTE: Due to using SSDT, the syntax is the following for the above:
Format([Measures].[Internet Sales Amount]*1.1,”$#,##0;($#,##0)”)
c. NOTE: Because we are using a currency we formatted our Goal Expression so that when it displays it will display correctly.
6. Next is the Status details.
a. First what we did was to change the Status Indicator to a Shape as shown below:
c. NOTE: The reason that we did this, is so that when it is displayed in Excel you can see it easily based on the Shape Colour.
d. Then for the Status expression we configured it with the following:
f. Here is the text below if this is not clear enough:
Case
When KpiValue( “Internet Sales Growth” ) / KpiGoal( “Internet Sales Growth” ) > 1
Then 1
When KpiValue( “Internet Sales Growth” ) / KpiGoal( “Internet Sales Growth” ) <= 1
And
KpiValue( “Internet Sales Growth” ) / KpiGoal( “Internet Sales Growth” ) >= .85
Then 0
Else -1
End
g. What we have done in the above Status expression is that if the growth is greater than 100% when comparing the Value to the Goal, then make the expression 1, which will make it green.
h. What we have done in the above Status expression is that if the growth is less than 100% but greater than 85% when comparing the Value to the Goal, then make the expression 0, which will make it yellow.
i. Else it will be less than 85% in which case make it -1, which will make it red.
7. Then for the Trend section we did the following:
a. We changed the Trend indicator to the Status arrow.
c. NOTE: We did this so that when it is displayed in Excel it will display correctly.
d. Then for the Trend Expression we configured it with the following:
f. Here is the text below if not clear enough
Case
When (KPIValue(“Internet Sales Growth”),[Date].[Calendar].CurrentMember) >
(KPIValue(“Internet Sales Growth”),[Date].[Calendar].CurrentMember.PrevMember)
Then 1
When (KPIValue(“Internet Sales Growth”),[Date].[Calendar].CurrentMember) <
(KPIValue(“Internet Sales Growth”),[Date].[Calendar].CurrentMember.PrevMember)
Then -1
End
g. NOTE: What we are doing above is we are taking the KPI Value and comparing it to the previous member in our Date.Calendar Hierarchy.
i. The reason with using the Date.Calendar Hierarchy is that we can use any member or part of the hierarchy, it will then compare that to the previous value.
1. EG: If you use quarter it will compare quarters. Or if you compare Month it will then compare months.
h. If it is better than the Previous then make the trend 1 or Green Arrow.
i. If it is worse or lower than the previous, then make the trend -1 or Red Arrow.
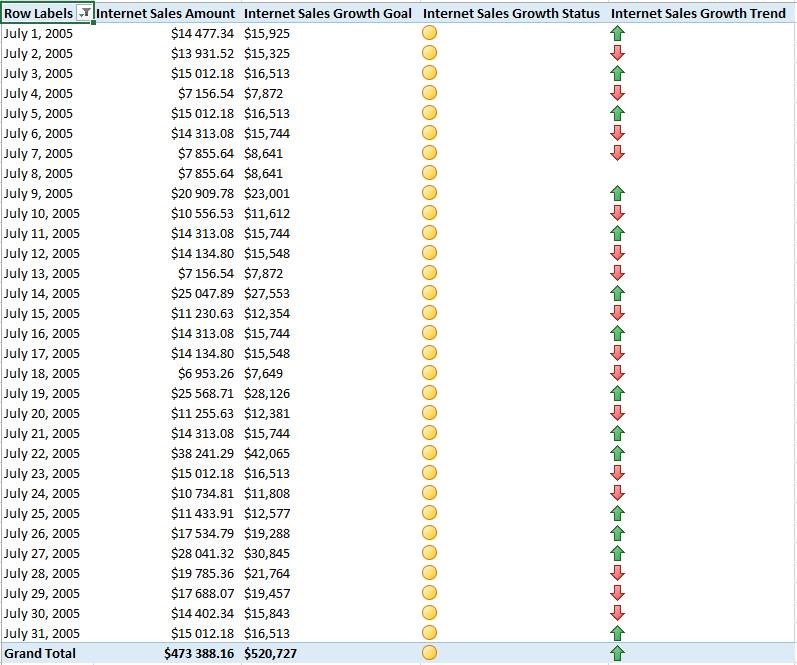
8. Now if you process your cube and view the results in Excel it will look like the following for July 2005, where we are using the Date.


Thank you gilbert. Allah razı olsun